


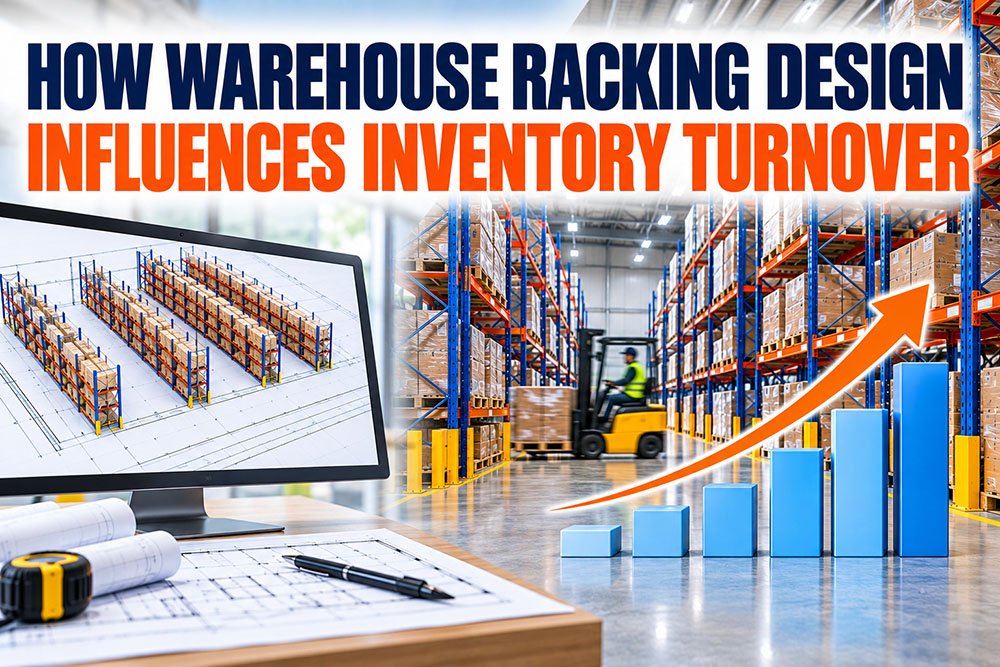
Inventory turnover is one of the most widely tracked metrics in supply chain and financial management, yet the connection between the ratio on the CFO’s dashboard and the physical warehouse where inventory actually moves is often underexplored. High inventory turnover reflects efficient sales relative to stock levels; low turnover reflects excess inventory, slow-moving SKUs, or supply chain inefficiency. What is less discussed is that the warehouse design, racking configuration, slotting strategy, and rotation methodology directly shape whether an operation can actually achieve the turnover ratio its business model requires. A warehouse designed and equipped for slow bulk storage cannot easily support high-velocity fulfillment, and a warehouse designed for high-throughput e-commerce cannot economically accommodate long-cycle inventory. Racking choice is not neutral — it enables or constrains the turnover profile.
This article explains what inventory turnover is, how it is calculated, what a good turnover ratio looks like across industries, and how warehouse design and racking configuration shape the turnover an operation can realistically achieve.
What Is Inventory Turnover?
Inventory turnover is an operational and financial metric that measures how many times a company sells and replaces its inventory over a defined period — typically annually — calculated by dividing the cost of goods sold (COGS) by average inventory, and providing insight into how efficiently the warehouse, racking configuration, and supply chain are managing stock relative to sales volume. A higher inventory turnover ratio indicates faster stock movement, lower carrying cost, and typically stronger cash flow; a lower ratio indicates slower movement, higher storage cost, and increased obsolescence risk.
Inventory turnover is often paired with Days Sales of Inventory (DSI), calculated as 365 divided by the turnover ratio, which expresses the same metric as the average number of days inventory remains in the warehouse before it is sold. A turnover ratio of 8 corresponds to approximately 46 DSI; a ratio of 12 corresponds to approximately 30 DSI. Definitional guidance from financial resources such as Investopedia and the ASCM supply-chain terminology reference provide broader accounting context, while the operational impact plays out in the warehouse.
Why Inventory Turnover Matters for Warehouse Operations
Inventory turnover directly shapes several warehouse-level decisions. Higher turnover concentrates activity on fast-moving SKUs, favoring racking configurations that support rapid access — selective racking, pick modules, carton flow. Lower turnover extends the average storage time per unit, favoring high-density configurations that minimize floor space per pallet — drive-in racking, radio shuttle, mobile racking.
Turnover also affects storage cost per unit. A pallet stored for 90 days accumulates 90 days of rack occupancy, labor, insurance, and utility cost; a pallet stored for 30 days accumulates only one-third that cost. Warehouses handling low-turnover inventory therefore benefit disproportionately from high-density storage that reduces cost per stored day, while high-turnover warehouses benefit from throughput-optimized layouts that minimize handling time per pallet.
How Inventory Turnover Is Calculated
The standard formula is straightforward:
Inventory Turnover Ratio = Cost of Goods Sold (COGS) / Average Inventory
Average inventory is typically calculated as (Opening Inventory + Closing Inventory) / 2 for the period, using inventory valued at cost rather than at retail price. Some organizations use sales revenue divided by average inventory valued at retail as an alternative, though the COGS-based version is the more widely accepted standard.
Days Sales of Inventory (DSI), derived from the turnover ratio, expresses the same concept in time units:
Days Sales of Inventory = 365 / Inventory Turnover Ratio
Both metrics reflect the same underlying velocity; the choice between them is primarily one of communication preference. Operational teams often prefer DSI because it maps directly to warehouse capacity and pallet-position planning; financial teams often prefer the turnover ratio for benchmarking and profitability analysis.
What Is a Good Inventory Turnover Ratio?
Ideal inventory turnover varies dramatically by industry, product category, and business model. Retail grocery operations often achieve turnover ratios of 15–25 (perishable goods must move quickly). Fashion retail typically targets 4–8 (seasonal cycles). Consumer electronics targets 6–12 (short lifecycle risk). Industrial parts and MRO can operate profitably at 2–4 (long spare-part hold times). Automotive parts distribution varies widely by segment.
No universal ideal exists. The right target depends on gross margin, storage cost, demand predictability, and supply lead time. High-margin, high-predictability categories tolerate lower turnover; low-margin, unpredictable categories require higher turnover to remain profitable. Benchmarking against industry peers is more useful than comparing across categories.
How Warehouse Design Affects Inventory Turnover
Warehouse design shapes turnover through multiple mechanisms.

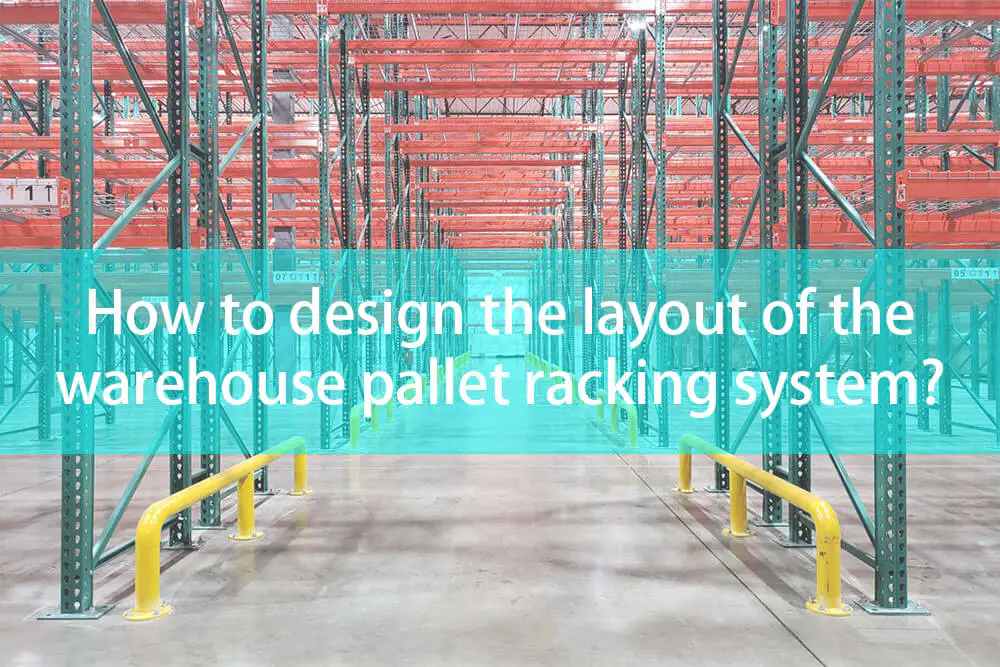
Throughput Capacity. Warehouses designed for high throughput — with adequate dock doors, sortation, and staging — support higher turnover because they can physically move inventory faster.
Layout Efficiency. Warehouses with poor internal layouts force longer travel distances per pick, increasing handling time and constraining maximum achievable turnover. Detailed guidance on warehouse planning and layout design directly affects the turnover ceiling.
Zone Design. Warehouses that separate fast-moving and slow-moving SKUs into distinct zones support both high-turnover and low-turnover inventory efficiently, whereas mixed-zone warehouses often optimize neither.
Automation Integration. Automated storage systems, conveyors, and pick technologies can significantly increase throughput per hour, supporting higher turnover than manual handling can achieve at similar accuracy and cost.
How Racking Configuration Affects Inventory Turnover
Different racking configurations produce fundamentally different turnover profiles.
Selective Pallet Racking. Provides full selectivity to every pallet position, supporting the fastest per-pallet access. Well-suited to high-turnover operations where each SKU may need to be accessed multiple times per day. However, low density means storage cost per pallet position is highest.


Drive-In Racking. Operates in LIFO (last-in, first-out) mode, making it well-suited to low-turnover bulk storage of homogeneous SKUs. Poorly suited to high-turnover or FIFO-critical inventory because the last pallet placed must be the first removed.

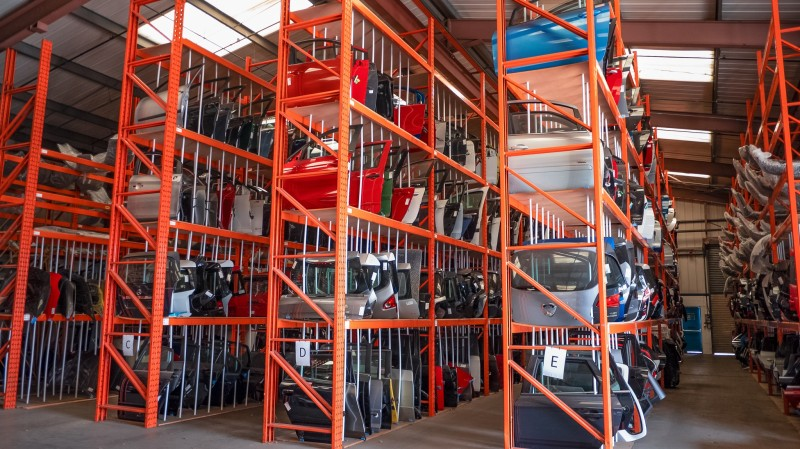
Push-Back and Pallet Flow Racking. Pallet flow racking provides strict FIFO rotation through gravity flow, supporting turnover profiles that require careful stock rotation. Push-back offers similar density with LIFO characteristics. Choice between FIFO and LIFO configurations depends on shelf life and obsolescence considerations — foundational context is available in the article on FIFO versus LIFO warehouse strategies.

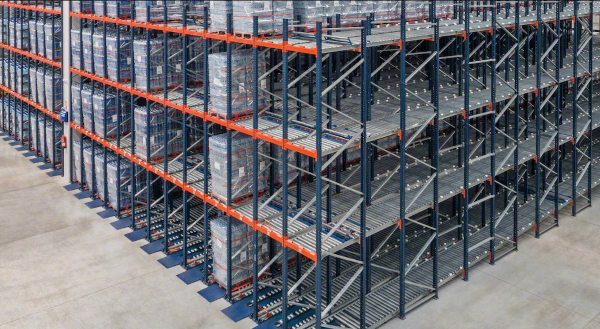
Radio Shuttle Racking. Supports both FIFO and LIFO modes with the highest density among selective-plus-rotation configurations. Well-suited to medium-to-low turnover operations that require rotation control but need higher density than selective racking provides.
VNA racking and mobile racking. Preserve full selectivity at higher density. VNA slightly increases access time per pallet due to specialized forklift movement. Mobile racking increases access time significantly due to aisle-opening delays. Both configurations suit medium-turnover operations where density matters as much as throughput.
FEFO (First-Expired-First-Out) Configurations. For pharmaceutical, food, and other expiration-sensitive inventory, FEFO stock rotation strategy requires specific racking and WMS integration to enforce rotation by expiration date rather than by receipt date.
Slotting and Zoning Strategies to Improve Turnover
Beyond racking selection, several slotting strategies improve turnover within a given warehouse configuration. ABC classification — placing high-velocity A-items in the most accessible zones, medium-velocity B-items in secondary zones, and low-velocity C-items in less accessible areas — reduces average travel time per pick. Golden zone slotting places fast movers at ergonomic pick heights (waist to shoulder level). Seasonal slotting reconfigures slot assignments quarterly to reflect changing demand patterns. Cross-docking bypasses long-term storage entirely for high-velocity SKUs that flow directly from receiving to shipping. Detailed considerations covered in the warehouse racking selection guide address the interaction between slotting and racking configuration.


Common Mistakes That Lower Inventory Turnover
Several recurring errors reduce inventory turnover unnecessarily. Applying high-density LIFO configurations (drive-in) to SKUs that would benefit from FIFO rotation, causing older stock to age or expire. Placing high-velocity SKUs in low-accessibility zones, extending pick time per order. Failing to update slotting assignments as SKU velocity changes, allowing formerly fast movers to remain in premium zones after demand shifts. Over-buying inventory to secure supplier discounts, inflating average inventory and depressing turnover. Under-investing in warehouse automation for operations that have grown beyond manual handling capacity. Ignoring the interaction between warehouse layout and turnover ratio, treating them as separate performance domains.
Comparison Table: Racking Configuration vs Turnover Profile
| Racking Configuration | Turnover Fit | Rotation Method | Storage Density | Best For |
|---|---|---|---|---|
| Selective Pallet Racking | High turnover | Any | Baseline | Fast-moving SKUs, e-commerce |
| Drive-In Racking | Low turnover | LIFO | +60–75% | Bulk storage, homogeneous SKUs |
| Push-Back Racking | Medium turnover | LIFO | +40–60% | Medium-velocity bulk |
| Pallet Flow Racking | High turnover with FIFO | FIFO | +40–60% | Fresh food, dated inventory |
| Radio Shuttle Racking | Medium turnover, flexible | FIFO or LIFO | +80–100% | Cold storage, high density |
| VNA Racking | Medium-to-high turnover | Any | +40–50% | Space-constrained fulfillment |
| Mobile Racking | Low-to-medium turnover | Any | +80–90% | Cold storage, pharma, archival |
The correct match between turnover profile and racking configuration determines whether the warehouse operates efficiently or spends resources fighting against its own physical constraints.
How to Improve Inventory Turnover Through Warehousing
Step 1: Measure Current Turnover by SKU Category.
Calculate turnover for high, medium, and low velocity SKU groups separately. Aggregate turnover figures hide underlying imbalances that drive operational inefficiency.
Step 2: Match Racking Configuration to Velocity.
Assign high-velocity SKUs to selective racking or pallet flow; medium-velocity to push-back or shuttle; low-velocity to drive-in or mobile racking. Mixed velocity in a single configuration constrains overall efficiency.
Step 3: Apply ABC Slotting Within Each Zone.
Place fastest movers at ergonomic pick heights closest to shipping. Update slotting quarterly to reflect demand changes.
Step 4: Enforce Rotation Method by Configuration.
Use FIFO configurations (pallet flow, gravity flow, shuttle FIFO) for perishable and dated inventory. Use LIFO configurations (drive-in, push-back) only where rotation does not matter.
Step 5: Reduce Handling Steps Through Layout.
Cross-dock the fastest movers where possible. Minimize travel distance between receiving, storage, and shipping for high-turnover SKUs.
Step 6: Verify Warehouse Safety and Standards Compliance.
Confirm compliance with rack design standards from the Rack Manufacturers Institute (RMI) and workplace safety guidance, including OSHA warehousing hazards and solutions, throughout any layout or configuration changes made to improve turnover.
Key Takeaways
- Inventory turnover measures how many times inventory is sold and replaced per period, calculated as COGS divided by average inventory.
- Days Sales of Inventory (DSI), calculated as 365 divided by turnover ratio, expresses the same metric as average days on hand.
- Ideal turnover ratios vary dramatically by industry — retail grocery targets 15–25; industrial MRO can operate profitably at 2–4.
- Warehouse design shapes turnover through throughput capacity, layout efficiency, zone design, and automation integration.
- Racking configuration directly affects the turnover profile a warehouse can support — selective and pallet flow support high turnover, drive-in and mobile suit lower turnover.
- FIFO configurations preserve rotation control; LIFO configurations sacrifice rotation for density.
- Slotting strategies (ABC, golden zone, seasonal) improve turnover within any given racking configuration.
Frequently Asked Questions
1. What is inventory turnover?
Inventory turnover is a financial and operational metric measuring how many times a company sells and replaces its inventory over a defined period, typically annually. It is calculated as Cost of Goods Sold divided by Average Inventory. A higher ratio indicates faster stock movement and lower carrying cost.
2. How does racking configuration affect inventory turnover?
Different racking types support different turnover profiles. Selective and pallet flow configurations support high-turnover operations with rapid access; drive-in and mobile configurations suit low-turnover bulk storage where density matters more than access speed. Matching configuration to turnover profile is a key operational lever.
3. Which racking type is best for high inventory turnover?
Selective pallet racking, pallet flow racking, and pick modules with carton flow all support high-turnover operations by providing rapid access to every SKU. Radio shuttle in FIFO mode also supports high turnover with better density than selective racking.
4. Which racking type is best for low inventory turnover?
Drive-in racking and mobile racking suit low-turnover bulk storage by maximizing density and reducing storage cost per pallet position. Both sacrifice access speed for density, which suits inventory that moves slowly.
5. What is the difference between FIFO and LIFO in warehousing?
FIFO (first-in, first-out) rotates the oldest inventory out first, preserving freshness and preventing obsolescence. LIFO (last-in, first-out) rotates the newest inventory out first, prioritizing density. FIFO is required for perishable and dated inventory; LIFO is acceptable for homogeneous long-shelf-life inventory.
6. How can I improve my warehouse inventory turnover?
Match racking configuration to SKU velocity, apply ABC slotting within each zone, enforce FIFO rotation for perishable inventory, reduce handling steps through layout optimization, and integrate WMS controls that enforce slotting and rotation rules. Measurement by SKU category — not just aggregate turnover — reveals where improvements are possible.
7. What is a good inventory turnover ratio?
Ideal turnover varies by industry. Retail grocery targets 15–25; fashion retail 4–8; consumer electronics 6–12; industrial MRO 2–4. The right target depends on gross margin, storage cost, demand predictability, and supply lead time. Benchmarking against industry peers is more useful than universal targets.
8. Does high inventory turnover always mean high warehouse efficiency?
Not necessarily. Very high turnover can indicate understocking, missed sales, or overly aggressive inventory reduction that reduces service level. Well-managed operations balance turnover against service level, stockout risk, and supplier lead time. High turnover matters most when combined with strong order fulfillment and low stockout rates.
Conclusion
Inventory turnover is often treated as a financial metric to be monitored, but it is actually shaped by physical decisions made in warehouse design and racking selection. Warehouses configured for high turnover deliver rapid access, effective slotting, and rotation-enforcing racking; warehouses configured for low turnover deliver high density and low storage cost per pallet position. Neither approach is inherently better — the correct match depends on the turnover profile of the business. Warehouse operators who understand the interaction between turnover ratio and racking configuration make better procurement decisions and achieve stronger operational outcomes than those who treat the two domains as separate performance areas.
For warehouse operators pursuing higher inventory turnover through improved storage system design, matching racking configuration to SKU velocity and rotation patterns is a decisive operational lever. Mracking is one of the Chinese manufacturers producing pallet racking systems that support diverse inventory turnover profiles — including selective racking for high-velocity SKUs, pallet flow and radio shuttle for strict FIFO rotation, and drive-in racking for low-velocity bulk storage — across selective, drive-in, push-back, pallet flow, radio shuttle, VNA, and mobile pallet racking configurations engineered to specific operational and turnover requirements.